Power BI dashboard of French historic monuments
The 46,760 protected monuments of the Mérimée database, looked at this time the way a data analyst would: cleaning, measures, interactive visualisation.
- Period
- October 2026
- Type
- Personal project
- Data
- Mérimée database, 46,760 records
- Tool
- Power BI Desktop
Starting point
The Mérimée database records the buildings protected as historic monuments in France; the Ministry of Culture publishes it as open data. I usually work on this corpus from the NLP side, for information retrieval and RAG. Here the goal was different: learn Power BI and ask an analyst's questions of the same records — how many, where, from which period, protected when?
Data preparation
- Protection: the source field mixes dates and statuses (“1980/01/25 : classé MH ; 1980/01/25 : inscrit MH”). It is split into a type (classé, inscrit, not specified) and a year.
- Century: an M formula reduces “4e quart 15e siècle ; 1er quart 16e siècle ; 17e siècle” to the century of the first building campaign.
- Coordinates: the GPS field is split into latitude and longitude, typed with the locale that matches the decimal separator.
- Quality: missing values labelled “Non renseigné” (not specified), double regions reduced to the first one, and three mistyped dates excluded — they were enough to flatten the whole timeline chart.
Measures and visuals
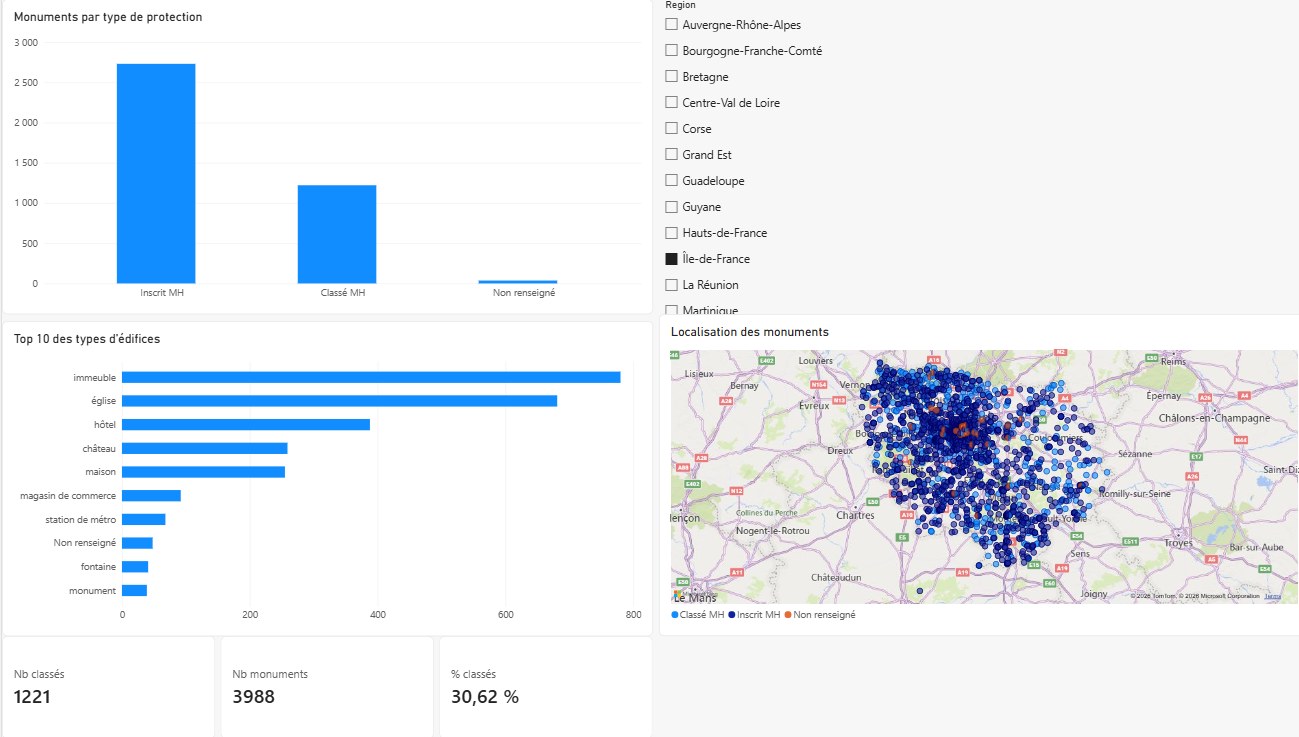
Three DAX measures are recomputed under the active filters: the number of monuments (COUNTROWS), the number of “classé” monuments (CALCULATE) and their share (DIVIDE).
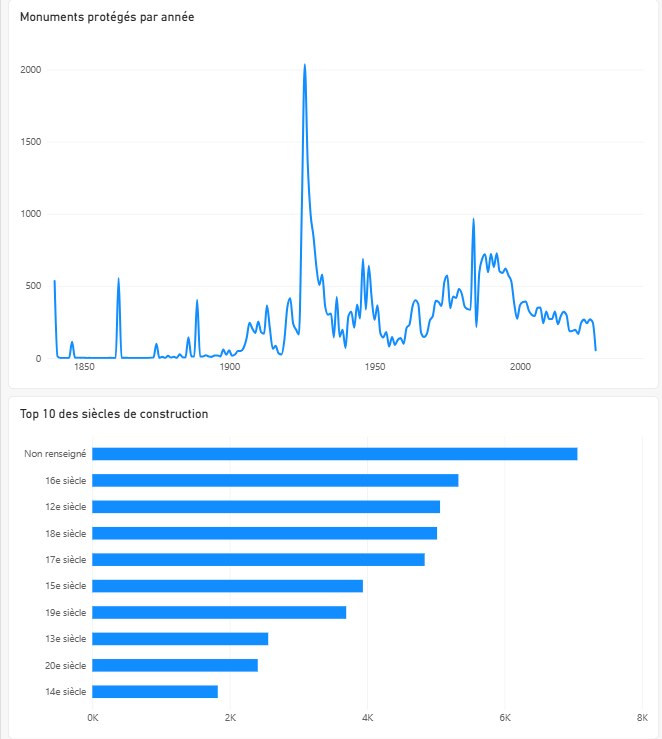
The report has two pages. The first gives the overview: breakdown by protection type, ten most frequent building types, map of the monuments and a region filter that updates every visual. The second is about time: protections per year since 1840 and the most represented centuries of construction.
What the data show
- Churches dominate: 10,118 records, ahead of houses (5,802) and châteaux (5,704).
- 534 records carry a protection dated 1840, the year of the first list of historic monuments.
- Among known centuries, the 16th comes first (5,328 records), ahead of the 12th and the 18th.
Limits
Mérimée is mostly a textual and categorical database, so the measures remain counts and proportions. A monument that is both “classé” and “inscrit” is counted as “classé”, and a monument spanning two regions is attached to the first one. This is a first dashboard, built to learn the tool; above all it reminded me that half of the work lies in data preparation.
Power BI Desktop · Power Query (M) · DAX